Portfolio


Quant - Adobe
AI Trust Score
If you were to ask the general public, “How many images on X (Twitter) do you think have been Photoshopped?”, most people would likely respond with “all of them” or “most.” While this may seem like a casual quip about our digital culture, it reflects a serious and growing concern: the erosion of visual trust online. For newsrooms and publishers, the ability to reliably distinguish between authentic and manipulated imagery is not just a technical necessity, it’s a safeguard for journalistic integrity.
In partnership my research scientists at Adobe, The New York Times, and X (formerly Twitter), I led UX research and strategic development of a forensic tool designed to:
a) Identify whether, where, and how an image has been modified, and
b) Calculate a “Trust Score”, combining image forensics, metadata, and user-level signals from the X platform.
The foundation of this system leveraged AI models trained on Adobe Stock images and extended to metadata inspection and file-level anomaly detection. Naturally occurring photos or phenomena have some amount of randomness or noise. Systematic changes to that are often the result of a mutation or manipulation. Our research built on Adobe’s Content Authenticity Initiative (CAI), incorporating advanced detection of manipulations such as compositing, pixel-level edits, and warping—using both image content and provenance indicators.
My contribution centered on understanding how professional users (e.g. specifically journalists, editors, and fact-checkers) evaluate images under time pressure and high stakes. Through structured interviews and thematic coding, I synthesized their evaluation criteria and created a weighted framework for Trust Score computation, prioritizing the signals most relevant to real-world journalistic workflows.
To validate this model, we conducted a pilot study with newsroom partners, using a curated set of known manipulated and unaltered images. This allowed us to fine-tune the Trust Score’s sensitivity and relevance, directly training the system based on how real journalists judged visual credibility. Their feedback was instrumental in optimizing thresholds and interpretability, ensuring the tool supported their editorial judgment.
The result was a prototype Photoshop plug-in built for enterprise use, in partnership with X, enabling journalists and other professionals (law enforcement etc) to inspect the trustworthiness of images. Beyond validation, the tool became a conversation starter about AI transparency, content provenance, and the future of trust in media. It led to initiatives to predict and train this model using AI with some safeguards and inputs from industry. Moreover, this research paved a framework for the transparency tool and content credentials in Adobe Firefly.

Quant - Adobe
Colorize Neural Filters
“Can you help me run this T-test?”
A colleague of mine in product had asked me to confirm they were performing a T-Test correctly on some survey data. My "spidey" sense was activated as it has been rare occurrence to see a survey question that was a) normally distributed and b) was appropriate for a T-Test. This survey displayed various color corrected images, some by the AI and some by the previous tool and asked respondents to indicate if they thought the image had been corrected in a culturally inappropriate way.
I dove deeper into what was the problem they were trying to solve: On average, does the AI cause more harm in color correction than the previous version making the adjustments. This process is very common when deciding to ship new features to determine whether or not to launch a new model. I considered very quickly the implications of "colorizing" a photo and that harm on average is not what we should measure, rather we should measure is it specific and systematic harm.
I reviewed the dataset and conducted my own analysis evaluating the pairs of images to see if the AI was systematically modifying images in ways that were perceived more harmful than the previous. I found a set of about 12 images that were significantly rated as more harmful than the previous version. The T-test result, as it focuses on the mean, ignored these powerful, painful, outlier cases. My analysis revealed there was a difference between the two versions.
I took the 12 images and consulted a colorist consultant, professional photo editor, and asked them if they could identify what the AI was doing incorrectly in these images. We determined that for the majority of the images if person in the image had little to no contrast with the background, the AI would create contrast that was inappropriate. Such that if the person in the photo had a similar color of skin tone in the photo as the background, it would over lighten or over darken to create contrast. I used this information to only allow the new AI to correct photos within a defined contrast until we could better train it on how to edit these photos.


Quant - SimplePractice
AI Documentation
One of the most persistent and burdensome challenges facing physicians today is documentation. Many clinicians spend hours after their scheduled workday - often at home, late into the evening - completing medical notes and reports. This not only contributes to physician burnout and strains personal relationships, but also negatively impacts the patient experience, with delays in receiving essential documentation like referral letters or visit summaries.
First, some background - before transitioning into the tech sector, I spent nearly eight years working directly in healthcare. Early in that time, I was deeply involved in onboarding physicians from paper charting systems to electronic medical records (EMRs), a shift mandated by federal policy. This work exposed a critical design gap: the available tools were not built with physicians in mind - especially those who had never used a computer before. And EPIC, the leading EMR, was an EPIC pain in the you know what… Many of the clinicians I supported didn’t know how to copy and paste, and some had never even typed a sentence on a keyboard. I worked closely with multiple hospital systems and dozens of providers to guide them through the transition, and through that process, I identified clear opportunities to make documentation more accessible and less error-prone.
I began developing lightweight, pragmatic solutions - like custom scripts that auto-populated base note templates based on visit types (e.g., initial consultations vs. follow-ups). I also provided the physicians with dictaphones and leveraged typing tools, like Dragon Naturally Speaking, to dictate their notes. For the dermatology and orthopedic teams, they also needed images accompanying their notes. I brought in digital cameras and wrote a script to insert the photos into the chartnote. Even these small enhancements significantly improved speed, reduced errors, and empowered physicians to focus more on patient care than paperwork.
Fast forward to my time at SimplePractice - despite the growth of health tech, the pain around documentation remains. Many clinicians still struggle with time-consuming note-writing, and the pressure is amplified for those in private practice who don’t have large support teams. The potential to leverage AI and machine learning to reduce this burden was immediately apparent to me. However, introducing these tools wasn’t just a matter of technical feasibility - it required thoughtful exploration of user trust, ethics, and regulatory sensitivity.
Many clinicians expressed hesitation, particularly around the use of proprietary knowledge in training models, risks to client confidentiality, and the fear that insurance companies could misuse AI-generated data to deny coverage. To better understand these concerns, I led a series of in-depth interviews (IDIs) and conducted broad-based surveys with our clinical users to map their attitudes, habits, and thresholds for trust when it comes to intelligent documentation support. Most importantly, I uncovered when and where they were completing documentation, and it wasn’t the office. This discovery helped us prioritize a mobile-based version to cover basic appointment types.
Moreover, many clinicians would stack their appointments back to back and only have 10 minutes between each client on a given work day. This 10 minute time period was the most ideal time for completing documentation but also competed with everything else a clinician may need to do, such as answering a personal message, using the bathroom, or grabbing a snack.
With these insights, I collaborated with cross-functional product teams to design and prototype a set of AI-assisted documentation features. We prioritized transparency and control - designing clear guardrails, opt-in mechanisms, and contextual feedback loops - to ensure clinicians felt supported, not replaced. Our approach centered on augmenting the clinician's voice, not automating it away.
This work reflects a throughline in my career: identifying where technology fails its users, and co-creating solutions that go beyond functionality to be deeply empathetic to the real-world context in which they are used.

Quant - Adobe
Value of Design
Adobe’s VP of Design, Jamie Myrold, approached me with a strategic question: “How do we measure the value of a design decision at Adobe?” This arose in the context of leadership exposure to the McKinsey framework for assessing design value within organizations. While the McKinsey model offered a starting point, there was a need to tailor a measurement system that reflected Adobe’s unique culture, workflows, and leadership needs.
My task was to create a framework to evaluate the impact of design decisions in a way that resonated with Adobe’s internal stakeholders and could be operationalized across different organizational layers.
I began by conducting an internal survey to understand how Adobe teams perceived the characteristics of a "valuable" design decision and which attributes they prioritized. I considered variables such as team function, organizational hierarchy, and relational partnerships. Based on this qualitative and quantitative input, I developed a scalable measurement strategy that aligned with our product and design lifecycle.
The resulting system included:
-
A pre-discovery questionnaire to define intended value
-
Mid-project checkpoints to assess alignment and course-correct
-
A post-launch recap survey to reflect on realized value
This framework was designed to complement traditional business KPIs by surfacing human-centered and qualitative insights that were previously untracked.
The strategy provided Adobe leadership with a practical, context-sensitive way to assess design decision value beyond financial metrics. It became an integrated part of the design and product development cycle, allowing teams to articulate impact more clearly, inform future decisions, and align more deeply with strategic objectives.
At the conclusion of this project Jamie took a role at Apple and my other executive leadership partner acquired a VP role at a different company.

Quant - SimplePractice
AI Documentation
The Director of Finance at SimplePractice, a practice management software company for healthcare professionals, was worried that appointments per clinician had decreased and asked me to quickly find out what had caused the change.


Quant - Microsoft
Happiness and Productivity
My task was to "get the engineers coding all the time". This ask didn't seem sustainable or contributing to long term company goals. I reframed the problem and delivered a way through analytics to categorize work behaviors that was eventually scaled to consumer facing Microsoft products to measure productivity.


Quant - AWS
Reducing Support Tickets
While working on AWS Support under Andy Jassy’s organization, I was tasked with redesigning the AWS Support form. The Director of Engineering, Gary Gross, framed the goal as reducing the number of support tickets submitted by users.
At face value, the task was to redesign the form to lower ticket volume - but I recognized that this framed the problem too narrowly. I aimed to shift the focus from merely reducing tickets to improving the overall user experience of getting help, especially identifying opportunities where users could resolve issues without needing to submit a ticket at all.
I started by challenging the original premise - pointing out that if fewer tickets was the only goal, we could achieve that by simply removing the form. This reframing led Gary and I to align on a more user-centered success metric: enabling users to solve problems before needing to reach out.
To understand root causes, I:
-
Conducted a journey mapping exercise to analyze why and how users were ending up at the support form
-
Analyzed support ticket metadata and performed a text analysis on free-text fields
-
Identified a major usability flaw: users often submitted tickets to incorrect categories because the form structure reflected our internal org chart—not the user’s mental model
-
Noticed an unexpected pattern in the ticket language: many issues were simplistic (“I can’t connect”), not reflective of AWS’s highly skilled user base. This suggested a lack of visibility or understanding on the user's part, not necessarily a platform failure
I then led a series of user studies with customers who had submitted tickets to explore their mental models, decision-making process, and what blocked self-resolution.
This deep dive revealed that the problem wasn’t the form - it was the mismatch between system complexity and user visibility. The research led to broader changes in how we presented support entry points and surfaced help content. Our findings reframed the problem at a leadership level and set the foundation for better anticipatory support and proactive guidance - reducing reliance on the support form without simply hiding it. I leveraged this work to redesign AWS Support, which is covered in a second covert project.
Quant - Microsoft
Usability Scaling
Usability studies are expensive to run and take many hours of researcher time. Researchers are often deployed to conduct these studies too late in the process. It was impossible for a small team of researchers at Windows to test all features being shipped and we needed a way to deploy research resources to the areas needed. Coming off the heels of Windows 10, usability was a priority. I conducted a series of experiments, studies, and inquiries to better understand how to standardize, systemize, and scale usability studies. I leaned heavily on the work from Sauro and created a new metric called CSUM, which is the cumulative usability score. While similar to Sauro’s method, I used a process called conflation to compute the score rather than using the mean. Conflation takes into account the variance of a task, which is important as we want users to have a consistent experience across the products.
Additionally, I created a method for selecting which tasks should be part of the usability study that takes into account the frequency and importance of each task. Such that there are different learnability and usability expectations of a frequent task (e.g. logging in to your device) in comparison to a less frequent (e.g. changing your billing information).
Beyond these two methods I also created a reported system that could self-generate insights from previous research reports. With all these tools I then made markers in our analytics and telemetry and was able to approximate usability metrics based on telemetry data thus allowing us to have a listening system to check for potential usability problems and flag those as follow-up for our stakeholders. Microsoft still uses these methods. The team I trained to use them have gone on to other companies now and have continued to use these methods and process for standardizing and scaling usability.
If you want to know more about conflation, check it out.

Vision
Performance
Institute
Vision Ergonomics - VPI
Visual Discomfort in 3D
These projects spanned partnerships with Intel and Microsoft to better understand the visual experience when viewing 3D. The work I did in these projects eventually led to rules around disparity, luminance, and comfort for what is now Hololens. I performed eye exams, applied EMG, and modified the simulator sickness questionnaire to better meet the needs of this research. I conducted all the research sessions and analyzed the blink rate, eye tracking, and survey data. I was brought into this project because they needed to adapt the study for children and my previous work in child psychiatry. I was familiar with the protocols for measurement for children and families.

Vision
Performance
Institute
Vision Ergonomics - VPI
3D Display Viewer Preferences: 3D movies
These projects were completed as a partnership with LG and Samsung to better understand luminance in different lighting conditions on different kinds of displays (backlit or e-ink). This research included movie theater research which we pilot tested in a lab theater I co-designed with my partners in Korea. We designed duplicate labs, one in the USA and the other in Korea.
For these studies, I started with very controlled and strategic tests before moving on to longer feature films. I learnt a lot about the production of films in order to select the stimuli for the 3D films.
This work included designing 3D glasses for people who are legally blind or have low-vision. I would make modifications to the devices with the simple use of duct tape and cardboard to test some issues with signals. Once the devices were ready, we completed theater experiments with the different glasses. This research came back to me later when I joined Microsoft and completed a special partnership with Dolby Digital for 4D sound.

Vision
Performance
Institute
Vision Ergonomics - VPI
Dynamic Optotype
As I had been trained to give full eye exams, I performed a series of studies evaluating new tools for measuring visual acuity. Visual acuity measures such as the Landolt C or the Snellen (you have likely seen this one), have certain characteristics that allow us to measure acuity. One important characteristic is called the critical gap. While doing an eye exam, they may ask you which way the E faces, but really what you are discerning is the space between the parts of the E. How you perceive that space will be dependent on your general acuity, contrast sensitivity, luminance, and many other factors. One motion based acuity exam was called Dyop. I found it as a useful tool for measuring peripheral vision and motion sensitivity, which for 3D and visual convergence this offered an opportunity to use 3D as a diagnostic tool in visual problems rather than the cause of vision issues.

Vision
Performance
Institute
Vision Ergonomics - VPI
3D Glasses for Gaming
I completed a series of studies on gaming with 3D glasses and general comfort. It was during these studies I discovered that motion sickness was more likely to occur for women with exophoria, their eyes naturally sit more outward than inward. Through this work I developed an observational scale of motion sickness rather than relying simply on participant self-report. This was an extension of the scales I had already been developing to measure the comfort of children when using these different displays.

Vision
Performance
Institute
Vision Ergonomics - VPI
Morphemes and Dyslexia
Due to my background in research with children, I was brought in to help with several studies regarding reading, dyslexia, and fonts. This work was sponsored by Microsoft. I conducted a series of experiments where I separated words with a small space by morphemes, phonemes, and a few others. This work involved eye exams, eye-tracking, and survey analysis. The results of this work went on to inform the OneNote plugin to help with reading as it showed improvements for readers who are dyslexic.

Design - AWS
Redesigning "Help"

Design System
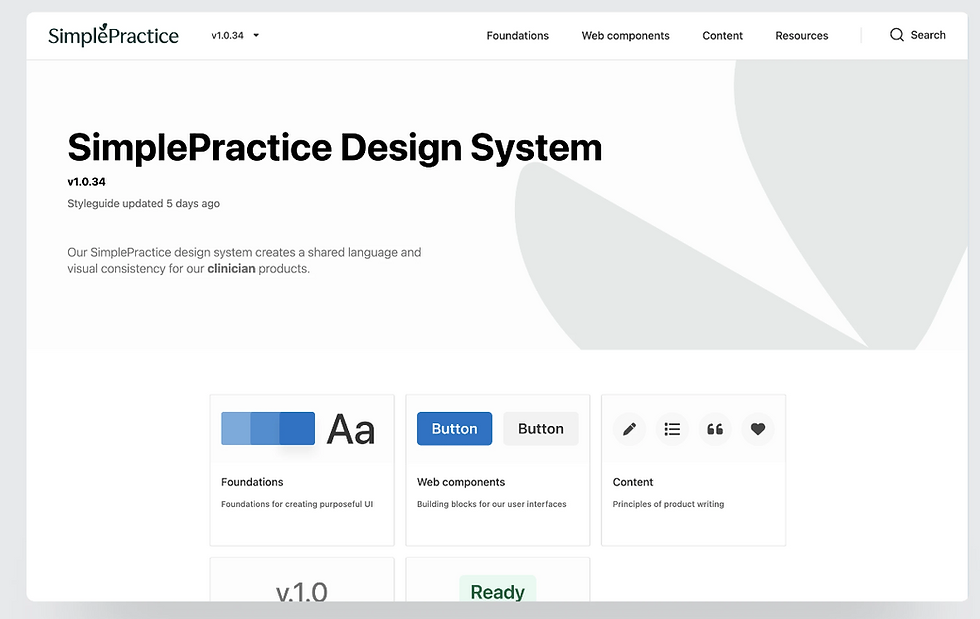
I joined SimplePractice at a pivotal time, as the company embarked on a full-scale redesign and rebrand of its product and marketing experience. With a lean team and myself as the sole UX researcher, I had to operate with both agility and breadth - moving fluidly between strategic input, hands-on research, and systems-level thinking to ensure the redesign delivered a coherent and meaningful user experience.
While the brand and design teams defined the new visual direction - including tone, typography, color, and illustration - I provided critical feedback on how these choices would land in practice. I assessed designs through the lenses of accessibility, cognitive load, and usability across our varied clinician user base. My role was to ensure the creative vision remained not just aesthetically pleasing, but inclusive, understandable, and effective in guiding user behavior.
SimplePractice is a marketing-led organization, where the product often races to deliver on what is already being promised externally. This reality created a tension I sought to resolve: how to build a design system that could scale consistently from a user’s first exposure (marketing site, landing pages) all the way into in-product workflows. I worked to align the visual and experiential language across these entry points so users didn’t experience cognitive dissonance or a “bait-and-switch” effect upon logging into the product.
To support this, I created user experience guidelines informed by both qualitative research and behavioral data. I focused especially on mapping the functional, social, and emotional "Jobs to Be Done" (JTBD) that users were trying to accomplish at each step—from exploration to task completion. This framework helped identify how visual and interaction design could either support or detract from user momentum, trust, and clarity. Additionally, I designed and implemented A/B tests to validate assumptions and measure impact across various touchpoints. I followed up with customers through interviews and feedback loops to understand their lived experiences with the redesign, using those insights to fine-tune both micro-interactions and macro experience flows.
This work ultimately helped lay the foundation for a more unified, scalable design system - one that bridged the marketing promise with product delivery, and anchored both in the real needs and expectations of our clinician users.


Design - RG&E
Classification Model
As part of a broader initiative for Avangrid, a major East Coast energy provider, I led multiple survey analyses to uncover key customer pain points. I developed a custom classification model to implement into their analytics to identify customers experiencing high energy burden and proposed targeted intervention. These interventions were around funded programs that could reduce or subsidize bills. Previous outreach had only been based on household income and did not take into account household size or county.
I also identified a recurring blind spot in account-based user models that in particular impacted those customers with multiple properties serviced by RG&E. My recommendations extended beyond analytics to include design and communication strategy, advising on optimal timing and context for mobile notifications and bill visibility to improve clarity and reduce confusion.
The engagement also highlighted systemic challenges within the organization. There was a significant gap between leadership’s expectations and how those were translated by intermediaries, leading to misalignment in data goals and scope. Despite these constraints, I successfully delivered actionable insights and solutions to two of the companies within Avangrid’s portfolio. After evaluating the organizational readiness for further impact, I made the decision to step away from continued involvement.


Cultural Psych - Research
Social Media and Happiness
In this paper, I explore how social networking sites have reshaped the landscape of friendship among millennials, particularly in relation to their sense of happiness and well-being. Drawing on the concept of networked individualism, I argue that while social media offers greater autonomy and expanded access to social capital, it simultaneously disrupts traditional forms of closeness by promoting broader, less intimate networks. I highlight the tension between meaningful connection and performance, showing how the pressure to maintain an idealized digital self can complicate authentic social interaction. Ultimately, I suggest that social media presents a double-edged sword—enabling new forms of support and expression while also introducing new vulnerabilities to self-worth and emotional fulfillment.


Cultural Psych - Research
Cultural Measurement Equivalence
In this chapter, I explore the critical importance of cultural measurement equivalence in cross-cultural research, emphasizing that valid and reliable assessment must go beyond direct translation to account for conceptual, functional, and metric differences across cultural contexts. I argue that many widely used psychological measures, often developed in Western settings, risk misrepresenting or oversimplifying constructs when applied globally. Through this work, I advocate for a more culturally grounded and ethically responsible approach to measurement—one that respects cultural nuance, supports scientific rigor, and ensures that our tools truly reflect the lived experiences of the populations we aim to understand.

Quant - Microsoft
In-App Surveys
In-app surveys are a great tool but need to be considered differently than standard surveys. Building out an in-app survey mechanism requires collaboration and governance from multiple skill sets such as product, engineer, research, and legal. As part of this tiger team, I standardized the questions, anchors, and analysis for product health in-app toasts. I also defined rules around user fatigue, sampling strategy, and flags for sensitive populations. By creating this framework, we were able to democratize the tools for the teams to get quick answers to their questions. This framework is used to measure all products and features across Windows and the standardized questions have been shared across the company.


Other - Boutique Resort
Plans & Packages
I led a side project for a boutique hotel undergoing a strategic shift from à la carte services to an all-inclusive resort model. My objective was to design data-informed package tiers that aligned with guest preferences while increasing profitability and operational efficiency.
The hotel had historically operated on a service-by-request model, with guests selecting activities or amenities individually. From my background in SaaS, I knew there was a better way to manage these services. The hotel management wanted to transition to a structured, package-based model to a) Improve guest uptake of services b) simplify operational logistics c) position themselves as an option in the all-inclusive resort market. However, their budget and market size ruled out advanced pricing methods such as conjoint analysis or Van Westendorp pricing.
I started by reviewing the data they already had collected. I leveraged several years’ worth of concierge data, including activity bookings, guest requests, and qualitative feedback. Through frequency analysis and sentiment review, I identified core service patterns and high-satisfaction touchpoints and potentially bundled services. While I could have conducted a market basket analysis to determine which service co-occur with the most lift, it wouldn’t have accounted for the opportunity areas with new partners that had not been offered to previous guests.
Based on the interviews with the concierge, I created guest personas and mapped service expectations, must-haves, and potential delight features for each such as “Adventure” or “Relax”.
I also conducted a competitive analysis of similar resorts and similarly sized properties, cataloging package tier structures, price anchors, and unique service inclusions. This informed both pricing thresholds and differentiation opportunities.
Drawing from my previous experience in pricing and packaging at a research agency and with SimplePractice’s growth marketing team, I designed value-based messaging for each package. The packages were framed to reflect desired vacation outcomes, and tiered to nudge guests toward selection rather than opting out entirely.
I applied principles from behavioral economics to influence package selection (e.g., decoy pricing, tier contrast) and ensured each package maintained healthy margin contribution yet funnel the guests to the package that was best for the hotel. I leveraged benefit-oriented copy and tiered value framing throughout these designs.
These changes led to package adoption to 90%, compared to approximately 50% under the à la carte model. My new pricing strategy also doubled the average profit per guest as it was based on a hypothesized “willingness to pay” rather than simply a percentage applied above their partner pricing. The premium package became the most selected, enabling the hotel to negotiate bulk rates and service-level agreements with local vendors. Lastly, the resort reported improved guest satisfaction scores and internal operational alignment due to more predictable service delivery.

Other - Boutique Resort
Lamps
I have done a lot of home remodeling in the past and was tasked with designing a nightstand lamp that could be a) custom sizes/scalable b) robust for a hotel c) inexpensive to produce. This is a story about meeting business needs but keeping in mind the customer experience.
I first did some research to better understand what solutions already existed (competitor analysis), the materials they used, and whether or not there was a good solution in place. Unfortunately, most of the pendant lamps available at the custom size needed were several hundred dollars each. I also looked into resourcing to determine inexpensive materials and selected plastic cups as the vessel.
I selected the plastic cup, not only due to the cost, but I considered that it would be a pity to use glass and have a guest accidentally break a lamp and ruin a night. I also selected dimmable warm light bulbs given they would likely be used at night.
As with most research, I conducted a pilot with the plastic cups to confirm they met all my criteria before proposing them to the business. They looked elegant and I was pleased but I found that after a few hours the cups had melted! I had forgotten to account for the heat produced by regular light bulbs. I made the change to LED bulbs and the lights passed all my metrics for “ship”. Produced and installed for less than $10 per nightstand these lights met both the user and business needs.
_HEIC.png)
Other - Boutique Resort
Food Delight
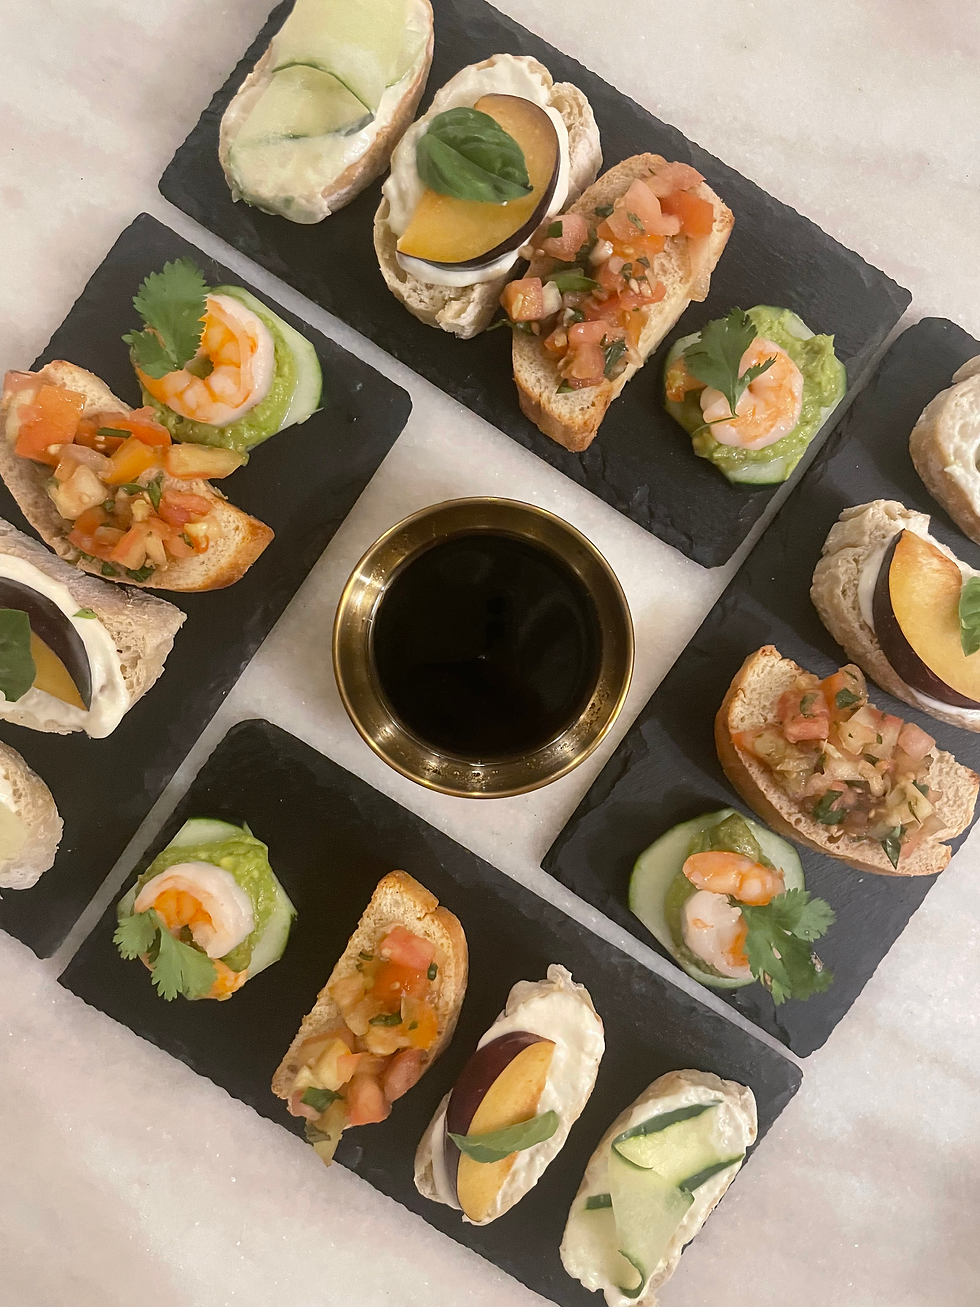
Over my career in research, I have needed to have something on the side with more immediately tasty results so I have opened a few restaurants. Similarly to research, I like thinking through the assumptions we make and the relationships between certain cuisines. I think a lot about the various types of lipids/oils, their compounds, properties and how they change with interaction of other substances. I like the puzzle of a large dinner party with various restrictions or preferences and really think outside the box with ingredients.

Methods: Research Design
Decision-Backwards Research Design
Before I field a study, I often build the report first.
Using hypothetical data, I create a sample version of the final analysis and ask a simple question:
If these were the results, would we know what to do?
This forces the research plan to prove its usefulness before data collection begins.
A sample report quickly exposes problems that can be difficult to see in a survey or analysis plan alone:
-
Are we measuring the thing the business actually needs to decide?
-
Will the planned analysis distinguish between the alternatives we care about?
-
Are we collecting interesting data that ultimately lead nowhere?
-
Does the output raise obvious follow-up questions the study cannot answer?
-
Are stakeholders likely to interpret the findings correctly?
-
What information is missing before we commit respondents, time, and budget?
If the hypothetical report produces a conclusion like “interesting, but I still wouldn’t know what to do,” the study is not ready.
If it makes someone immediately ask “but what about X?”, I would rather discover that before launch and determine whether X belongs in the design.
This approach also makes complex quantitative methods easier to collaborate around. Instead of asking partners to evaluate a statistical analysis plan in the abstract, I can show them the decisions, charts, comparisons, and recommendations the methodology is intended to produce.
The workflow becomes:
Decision → Measure → Analysis → Sample Output → Decision Check → Field
I developed this practice after years of working with teams where not every stakeholder could evaluate a research plan technically—and where they should not have to. A good research design should be understandable through the decisions it enables.
For me, the sample report is not documentation.
It is a pre-launch test of whether the research itself is useful.
Mentorship
Mentorship is distinct from management - it’s not about aligning someone to a roadmap, it’s about helping them write their own. I’ve led teams of 30+ across disciplines, but mentorship operates on a different layer; it’s about investing in the person, not the role. I’ve seen how a well-timed question or a reframed narrative can challenge a limiting belief and shift someone from hesitation to momentum.
It is a space where people are allowed to ask the real questions - about identity, purpose, and how their work fits into something bigger. I don’t mentor to replicate myself; I mentor to help people locate their own direction in the complex world we live in. It’s where I get to help someone make sense of a transition, recognize their value, or move from imposter syndrome to clarity and fulfillment. It's one of the most lasting forms of impact I know.
* For the sake of anonymity, I have changed the names of the people shown here, and also used generated photos.

Sam
Sam’s resume landed on my desk after being passed over by several other hiring managers. At the time, I was standing up a new research function, one with no blueprint or roadmap. I needed people who could think creatively, adapt quickly, and bring a high level of analytical rigor to ambiguous problems.
Sam had a strong academic background in neuroscience, but his research had focused exclusively on rats, not humans. That fact alone was enough for other managers to dismiss him. But I saw something different. He had deep experience with experimental design, statistical analysis, and complex systems thinking. More importantly, his cover letter revealed genuine curiosity about human-centered research and a clear desire to shift into user research. He articulated not just what he wanted to do, but why - a sign of intrinsic motivation I look for in any high-potential hire.
I brought him onto my team as a contractor, and together we co-created a research system capable of producing 10 high-quality insights reports per week. As we scaled, I intentionally positioned myself as a bridge, connecting Sam with teammates across disciplines who could benefit from his analytical mindset and experiment design expertise. Whether it was helping a designer understand the implications of a behavioral pattern, or troubleshooting survey logic with a product analyst, I helped Sam plug into meaningful conversations where he could contribute and grow.
Through mentorship, project alignment, and structured support, Sam quickly adapted his academic knowledge to the needs of applied research. He not only gained confidence but also became a trusted thought partner for others on the team. His impact was undeniable, and we extended him a full-time offer.
Sam is now a Senior Research Manager at a top-tier tech company. I take pride in having seen his potential when others didn’t, and in having created the conditions, connections, and context for him to thrive.

Ruby
Earlier in my career, I worked at a crisis line in Tokyo, where I created the training and triage protocols for supporting callers in moments of acute need. That experience, along with my academic background in Clinical Psychology and hands-on work in intake for both adult and child psychiatry at Doernbecher Hospital, helped me develop a deep ability to recognize underlying emotional conflicts and meet people with empathy and presence. My time conducting research with monastics also strengthened my ability to listen without ego and to practice genuine, nonjudgmental support.
Later, I met Ruby, a new team member working in a related discipline, during an informal coffee chat. I usually approach these conversations with a light framework, but in this case, I felt it was more meaningful to ask: “Who do you want to be?” That question opened the door to a deeper dialogue about identity, aspiration, and vulnerability. Together, we explored Ruby’s vision for themselves, the challenges they anticipated, and how I could support them - both personally and professionally - through that process. I also introduced Ruby to others in my network who had navigated similar transitions.
Over time, Ruby embraced their authentic self and emerged as a powerful advocate for others navigating identity and change in the workplace. It’s been a privilege to support that kind of transformation, and to help foster an environment where others can do the same.

Alonso
Alonso and I first met in graduate school - we bonded instantly on day one when we both showed up wearing vests and jokingly became “vest friends.” Years later, when I was leading global statistical operations at a market research agency, I found myself preparing for a high-volume season. Though many of our processes had been automated, I knew I needed additional support.
At the time, Alonso was working as an adjunct professor at a community college. He was considering a move to industry but was apprehensive. His concerns centered around two things: not feeling proficient in R or advanced statistics, and fearing that a transition to corporate work would distance him from the meaningful teaching he had been doing with vulnerable student populations.
I saw an opportunity to support his growth, and brought him onto the team. I intentionally assigned him simpler projects at first - ones that would allow him to learn my systems, tools, and scripting syntax at a manageable pace. I also recognized a deeper challenge: Alonso had to relearn how to think about statistics for business contexts, not academic ones. That meant moving from theoretical depth to actionable insights, and from rigor for rigor’s sake to rigor aligned with decision-making speed - challenging assumptions for which statistical test you should use to analyze different data types. We worked together to reframe his mental models around “good analysis” in a way that honored precision but fit the needs of stakeholders and clients.
We held regular coaching sessions where we broke down technical concepts, discussed stakeholder expectations, and translated business needs into research questions. I also encouraged him to view his natural strengths - curiosity, precision, and empathy - as powerful tools, especially in navigating ambiguity and user-centered work.
To help him maintain his connection to the kinds of communities he cared about, I helped Alonso find local volunteer opportunities that aligned with his values. This allowed him to continue doing work with purpose, even as he grew his career in a new direction.
Over time, Alonso’s confidence grew, and he began to flourish in the applied research environment. He’s now a Principal Quantitative Researcher at a major company - someone who successfully bridged the academic-to-industry gap.